A September 1 Office of Legal Counsel opinion says every agency in a state participating in TANF or SSI is covered by federal reporting duties concerning people the state knows are unlawfully present.
Official GSA photograph of DOJ headquarters; illustrative only. Full attribution, date, source and context are on the article page.
ICE disclosed September 1 that a 51-year-old Chinese national died while detained at its Saipan facility. The release is an individual death notification, not a nationwide detention statistic or a final medical finding.
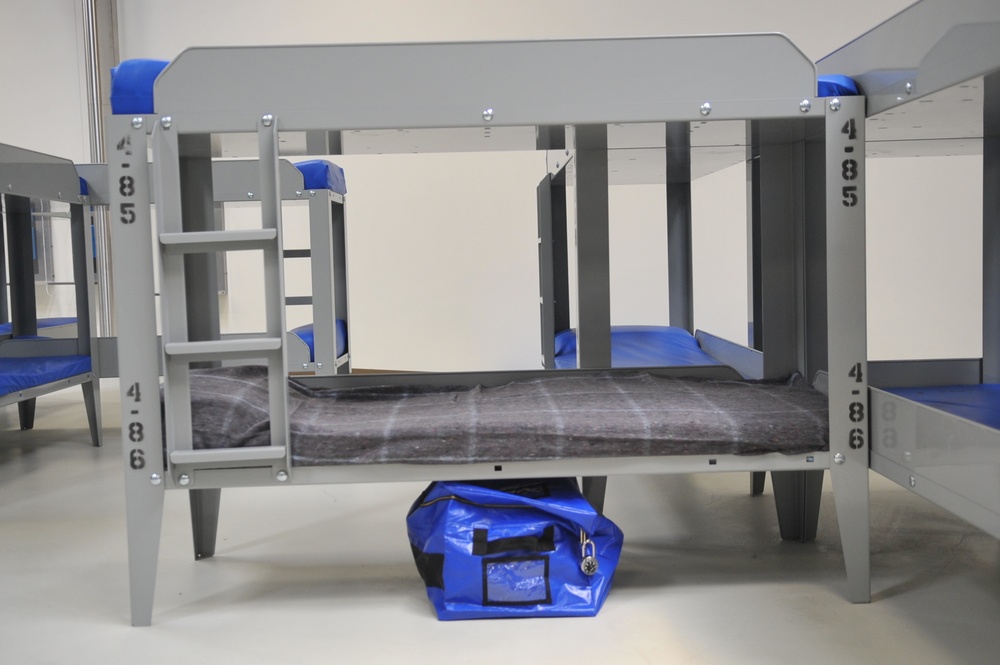
Official ICE photograph; full attribution, date, source and illustrative context are on the article page.
A general overview of the ICE Health Service Corps, the component that provides or arranges health services during ICE custody, transfers, and certain operations.
Official ICE photograph; full attribution, date, source and illustrative context are on the article page.
A plain-language overview of how CBP’s Office of Field Operations works at official ports of entry while the U.S. Border Patrol generally operates between ports.
Official CBP photograph of an OFO inspection at the San Luis port of entry; full attribution and context are on the article page.
Important data note: Federal enforcement data is not a live raid tracker. ICE publishes national and field-office statistics after a reporting delay, while CBP separately reports encounters and arrests at airports, land ports and borders. We label the agency and reporting period so unlike numbers are not combined.
A primary-source explainer separates five federal immigration-enforcement measures and shows why they cannot be combined into a live airport or city arrest count.
Editorial topic illustration; not a depiction of a specific arrest, airport, facility, city, or agency operation.
Latest official ICE snapshot
September 8 agency update: DHS stated in a dated release that ICE made 50,925 arrests nationwide during August 2026, compared with 50,208 in July. Those are agency-reported monthly totals in a press release—not a downloadable city, airport, field-office, detention-population, or person-level dataset. The release does not provide a methodology sufficient for a city ranking, and the figures should not be read as live activity. Read the DHS release ↗
The newest nationwide ICE arrest totals currently displayed in ICE’s public annual report are for fiscal year 2024. The separate ICE dashboard says its arrest, detention, removal and alternatives-to-detention data cover activity through December 31, 2024 and are published one quarter in arrears. Later official corrections can replace earlier figures.
Source and context: “Weekly ICE Video — Making America Safe Again,” released by DHS and dated April 7, 2025. This agency-produced video is included as a visual example only. It is not independent reporting and does not establish current national, airport, detention or city-level totals. View the original DHS record, description and download information ↗
Airports and ports of entry
Airport immigration inspections are generally conducted by U.S. Customs and Border Protection’s Office of Field Operations, not ICE ERO. ICE may make an arrest at or near an airport, but an isolated agency release does not establish a citywide or national trend. This page will report airport developments only when ICE, DHS or CBP publishes a dated official release or dataset.
CBP proposed removing Miami Seaplane Base from the federal lists of designated international airports. The August 21 publication is a proposal, not a final rule, and comments close October 20, 2026.
Editorial topic illustration; not a depiction of the facility, an inspection, passenger, arrest, or agency action.
For context, CBP’s official “Typical Day” summary for fiscal year 2024 reports approximate daily averages of 86 wanted-person arrests at U.S. ports of entry and 49 between ports of entry. Those figures cover all ports of entry—not airports alone—and should not be read as ICE arrests.
ICE’s public arrest dashboard groups geography by 25 Enforcement and Removal Operations areas of responsibility, which can cover multiple cities and states. We will publish a “most arrests” or “most detention” ranking only when a current official dataset provides comparable geographic totals. Individual news releases are examples, not a complete ranking.
ICE administrative-arrest, detention, removal and field-office datasets.
DHS or ICE operation summaries when they provide verifiable dates, places and totals.
CBP airport or port-of-entry enforcement, kept separate from ICE interior enforcement.
Relevant real photographs or videos from the official federal record, labeled with agency, release date and context.
Corrections, revisions and reporting-period changes made by the publishing agency.
Editorial standard: U.S. Immigration Brief does not publish rumors, crowd-sourced raid maps, operationally sensitive live tracking, or names of arrested individuals. Figures and official ICE, DHS, ICE, CBP, and OHSS sources were last checked September 13, 2026. OHSS’s monthly tables are retrospective, and its recently refreshed fiscal-year 2023 tables are historical rather than live ICE activity. CBP’s nationwide encounters data combines modes and regions and does not support an airport-only or city arrest ranking. Recent DHS and ICE releases describe individual arrests, removals, or operations rather than a comparable national dataset. No current official dataset supporting an airport-only or city-by-city nationwide ICE arrest ranking was identified in this review.
Legal information, not legal advice. This page summarizes public federal data and does not provide case-specific guidance or create an attorney-client relationship.
 DOJ legal opinion · not an ICE operation